Yes, I know. Another post on inclusionary housing. If my earlier posts made your eyes glaze over feel free to skip this one. But if you continue to be interested in what will be one of the most impactful housing policies Costa Mesa will ever adopt, read on.
Comparing housing policy across jurisdictions is slippery business. There is the obvious truism that no two cities are alike. But beyond baseline differences, there are analytical challenges, too. Often neighboring cities occupy the same labor market, meaning that policies in one jurisdiction will likely influence outcomes in others. And the entry of State laws and agencies into local planning can seriously mess with forecasting.
But despite these challenges the temptation to compare is irresistible. No city wants to feel like they’re going it alone. So let’s indulge the instinct and do a deep dive into the successes and failures in practice of one of our neighbors: Huntington Beach.
I’m focusing on Huntington Beach for a couple of reasons. First, our City Manager, Lori Farrell Harrison, had her last post in Huntington Beach, and has spoken passionately about that city’s success with inclusionary housing in the past. Second, its rental inclusionary housing program is similar to the one proposed by Staff and championed by Council Member Andrea Marr at the last City Council meeting, and may be even “lighter touch” in some areas:
| Policy | Huntington Beach | Costa Mesa (Proposed) |
| Compliance Options | create on-site units; create off-site units; preserve or rehab existing housing; pay in-lieu fee | create on-site units; create off-site units; preserve or rehab existing housing; dedicate land; pay in-lieu fee |
| Set Aside % | 10% | <60 DUA: 4% Very Low or 6% Low; >60 DUA: 7% Very Low or 11% Low |
| Threshold Project Size | 3 | 15 |
| % of AMI | 80% | Very Low: <50%; Low: 51-80% |
| Covenant Period | 55 Years | 55 Years |
| In-Lieu Fee Threshold | 100 Units | 50 Units |
| In-Lieu Fee | $3.58-$35.80/sq ft based on project size, capped at 2,000 sq ft | TBD |
Note that the set aside requirements are lower for larger projects (10% @ 80% AMI versus 11% @ 51-80% AMI) and in-lieu fees can be substituted for affordable units all the way up to a 100-unit project. Otherwise, the two ordinances are fairly comparable.
So how much for-rent affordable housing has the Huntington Beach inclusionary housing ordinance produced?
First, off the bat, I’m not going to go into the for-purchase inclusionary housing program in Huntington Beach, mostly because I don’t want to write 10,000 words on this. So we’ll focus on the rental side.
If you go to the Huntington Beach website, it helpfully discloses all of HB’s rental affordable housing units that the city is tracking in its system. It is a pretty impressive list that encompasses more than 2,500 units of deed-restricted affordable rental housing (don’t try and squint and read it; just know every row is a development containing affordable housing):

But how many of these units were produced by the inclusionary housing ordinance? Unfortunately Huntington Beach doesn’t come out and say it, so we’ll have to do some sleuthing. Let’s pare this list down a bit:
- First, take out all developments that have deed restrictions expiring within the next 15 years. As you may recall from the table above, HB’s inclusionary housing ordinance has a required 55-year covenant period, and that ordinance was first adopted in 2005. So if the covenant for the development will expire soon, it wasn’t produced by the ordinance.
- Next, also take out all developments where greater than 80% of the units are deed restricted. Again, the inclusionary housing ordinance only has a 10% set-aside requirement. Developments where most or all of the units are deed restricted were not produced by an inclusionary housing ordinance, but likely by some other program such as federal, state or local grants or tax credits.
So with those two tweaks, we get a list that looks like this:
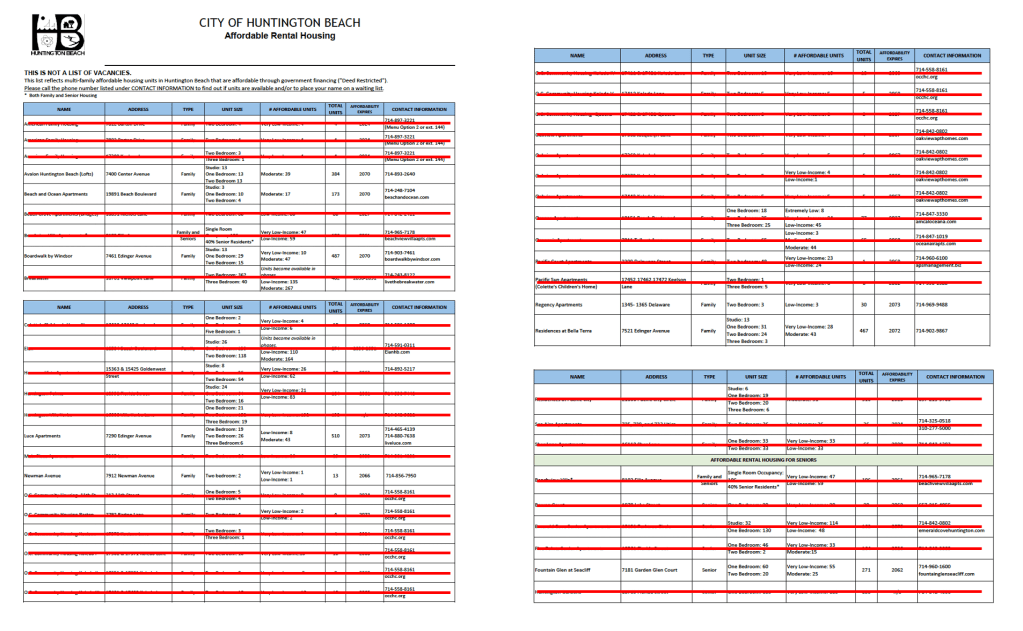
Oh dear. So what’s left?

So these are our eight developments in Huntington Beach that likely produced units under their inclusionary housing ordinance. I’ve added the columns in yellow to estimate their build date (taking their affordability expiration date and subtracting 55) as well as each project’s approximate density in dwelling units per acre (DU/AC). What can we learn from these eight projects?
- They tend to be very dense. As you can see, half of the projects are over 50 DU/AC, and some are way over 50 DU/AC. Even the small ones, like the 13 unit development on Newman Avenue, has a density of 60+ DU/AC.
- They tend to have a LOT of units. Most of them are well over 100 units, and half are over 350 units. But that may make a certain amount of sense; with the option to use in-lieu fees below 100 units, it may be because smaller developments are substituting fees for units (though that should tell us something). More on that in a second.
- They produced only a small % of HB’s overall affordable housing. The developments above represent only 320 units of deed restricted affordable housing, compared to over 2,500 units of such housing tracked by HB (or ~12.6%). So HB is producing and maintaining affordable units but most of them are not being created by the inclusionary housing ordinance, at least not directly.
- They are built infrequently. From 2011 to 2018, an eight-year span, there were eight developments built. I’m just a lawyer but I’m pretty sure that’s equal to a pace of one-a-year.
And finally, to me, here is the most interesting takeaway of all: Huntington Beach hasn’t built on-site affordable housing under its inclusionary housing ordinance since 2018. The rental list pulled from the HB website was dated January 2023, so maybe some have come online since then. But even if it did, it means HB has gone through at least a 5-year drought of producing affordable housing through its IHO.
Why? I have a guess:
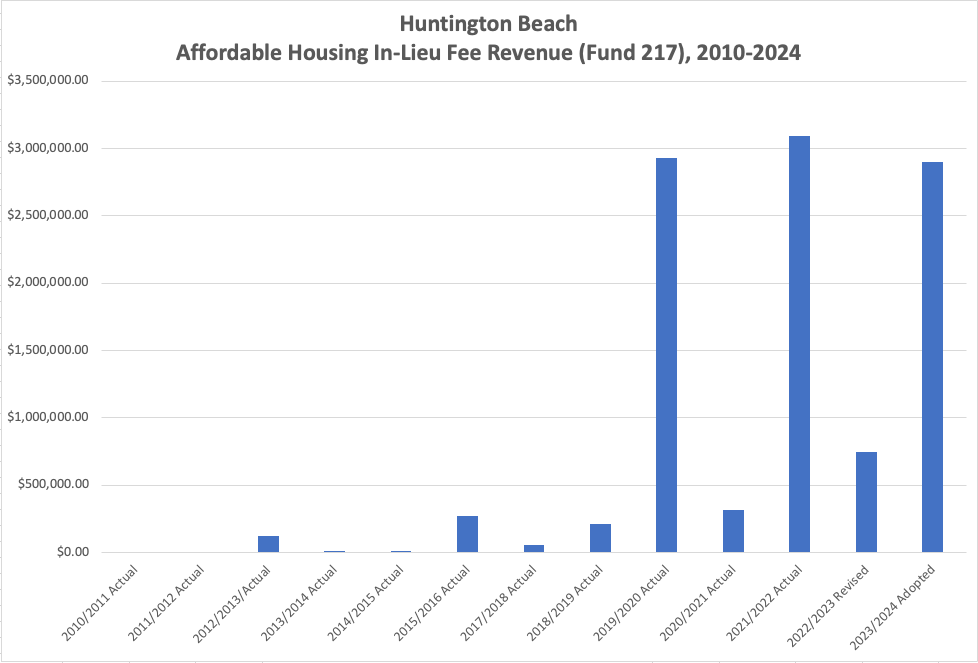
Sure looks like to me that, right around 2018/2019, developers started substituting away from on-site affordable housing development and towards paying the in-lieu fee.
I can only speculate as to how this might have happened. My guess is that the cost of producing an affordable unit (in terms of capital costs as well as foregone future rents) was cheaper than the in-lieu fee before 2018 and then, after 2018, those costs started to exceed the fee. That could be because it got more expensive to build in Orange County (it did) or because rents were rising sufficiently quickly that the math of capping rents on 10% of a project’s units for 55 years was too painful to justify, or both.
Now it looks like there will be some new IHO-generated affordable units in HB coming soon, as they are listed as pipeline projects in HB’s adopted housing element (jump to PDF p. 263). But, if you look closely, only for-purchase affordable units are listed as being generated by the IHO. All of the new affordable rental units are being developed under different programs; either one of Huntington Beach’s affordable housing overlay districts (which may have additional incentives) or using the State Density Bonus Law (SDBL), which applies everywhere, including Costa Mesa, regardless of local ordinance.
As a producer of affordable rental units, HB’s ordinance is looking like a bust.
And that’s even with more slightly generous provisions than the one Costa Mesa is currently considering!
Now, maybe HB’s in-lieu fee is simply too low, which is causing the substitution effect. But, more likely, HB’s IHO is limiting market-rate housing production to only those areas where additional incentives allow developers to produce the required affordable units and still pencil out. In that case, the reliance on in-lieu fees is a signal that the set-aside requirement is constraining overall housing development.
Is it possible that many of the 80%+ affordable housing projects are being built, in whole or in part, with help from in-lieu fees imposed by HB’s IHO? If that were the case, it would mean that HB’s IHO is helping to indirectly build affordable rental housing by generating fees that then subsidize non-profit developers to build 80-100% affordable projects. However, I think that’s somewhat unlikely simply because Huntington Beach received very little in terms of in-lieu fees between 2010 and 2018. Affordable housing can cost hundreds of thousands of dollars per unit to build when you factor in capital and construction costs, so averaging just over $81,000 a year in such fees isn’t going to build a lot of housing. While Huntington Beach clearly is doing something to generate interest in building affordable housing — based on recent rumblings about requiring property tax abatements to go to a popular vote, I’m guessing it has something to do with that — the IHO probably isn’t doing the work, either directly or indirectly. At least not by itself.
So what does this mean for Costa Mesa?
As I wrote before, comparison is the thief of joy (and time, now that you’ve slogged through this). But if a careful look at a neighboring city’s IHO can tell us anything, I think it is this: be conservative with an IHO. Huntington Beach’s program is slightly less onerous than the one going before the Costa Mesa City Council in the next few weeks, and even that program has clearly run into issues.
First, IHOs seem to really only produce units at significant scale, both in terms of density and total units. This means that imposing an inclusionary housing requirement on smaller, less-dense developments is effectively counterproductive; not only would it produce few affordable units per project, it is extremely unlikely those developments will be built at all. This is exactly the point Vice Chair Russell Toler stressed when Costa Mesa’s IHO was being considered at the Planning Commission level: below a certain size of development, you’re flogging a dead horse. You can impose a 1% set aside or a 50% set aside. In either case, those smaller projects just won’t be built, and you’ll get zero affordable units out of them.
Second, changes in the macroeconomic environment can easily undermine all of our careful calculations and throw the program out of whack. In 2018, HB’s IHO was producing affordable rental units. Then, in 2019, it stopped, and as far as I can tell, it hasn’t recovered. And while HB is now raking in in-lieu fees, I don’t think any city would (or should) adopt an IHO simply to generate revenue. Without careful, obsessive recalibration of our fees over time, we could easily see many years where no affordable units are produced simply because market factors shifted out from under our regulatory framework. We should ask ourselves if we are ready to commit to this long-term process.
And third, maybe an IHO can be crafted to minimally harm housing development, but it certainly doesn’t help housing development. In 2010, Huntington Beach had 79,166 units of housing and a population of 191,080, or about 0.414 housing units per person. In 2020, Huntington Beach had 81,494 units of housing and a population of 199,491. It terms of housing units per person, it had slipped to 0.409. Basically flat but slightly heading in the wrong direction. For ten years.
I still don’t like inclusionary housing as a policy. In my opinion, producing 320 deed-restricted affordable units over eight years just isn’t worth the distortions the policy injects into the development environment. We will never know how many units weren’t built because of the costs imposed by HB’s IHO. But if we have to have one, I really hope we err on the side of requiring less. Because in this case, less really might mean more.

Leave a comment