UPDATE, 6:35pm 5/15/25: Looks like the Daily Pilot has picked up the issues with the preemptive CAN “waiver”, too.
I listened through the Study Session this week and, unfortunately, it didn’t contain a lot of new information. The first hour and twenty minutes was consumed by staff presentations on the workloads and accomplishments of various departments. Then, when it was time for Council comments, most of the council members used their time to interrogate specific line items rather than ask big-picture questions. Honestly the whole presentation had a real Unikitty-from-the=Lego-Movie vibe:
Ok that comparison is probably unfair and might only work for those of you with small kiddos. I just couldn’t resist. Anyways…
The exception to this were the comments from Mayor John Stephens. As previewed, the Staff’s budget assumes that the City Council will “waive” the requirements of the capital asset needs (CAN) ordinance, which would otherwise require the city to allocate almost $7 million to the CAN fund (fund 401) in FY 2025-2026. Ever the lawyer, Stephens didn’t seem particularly satisfied with the legal justifications for the preemptive “waiver”, nor the prospect of putting the city on the hook for paying back this foregone $7 million in future years as the CAN ordinance appears to require.
And that really is the question of the budget season. Setting aside the technical strengths/weaknesses of the CAN ordinance itself, if you think the city ought to set aside some money every year towards its capital asset needs, then we are almost $10 million in the hole between last year and this coming year. So instead of reviewing the blow-by-blow of the study session — remember I told you last time that you should go watch it yourself? 😉 — I’m going to see what I can make of the numbers presented by staff. And I’m going to pull in 🤖🐐ROBO-Goat to help.
TWO WARNINGS: First, the rest of this post is long, full of numbers and tables, and is very, VERY boring. So stop now if you aren’t into that sort of thing. Second, this is what I’ve chosen to look at in the budget. The budget is over 300 pages long. I am NOT going to provide you with a comprehensive summary of every department and nuance. The analysis is necessarily selective and high-level. So take it with a grain of salt.
Do we have a revenue problem, or a spending problem?
Again, let’s look at the CAN ordinance requirement as effectively our “budget deficit”. Why? Well, although the FY 25-26 budget proposed by staff is “structurally balanced”, it would be about $7 million in the red if the CAN ordinance requirements were followed. So that’s the bogey we’re hunting for — $7 million in missing funds. Let’s start with revenue. Is it that we aren’t bringing in enough money?
The revenue hypothesis
Right off the bat it is clear that revenue misses can’t fully account for our $7 million gap. As you can see below, general fund revenue is only projected to be off by about $3 million this year compared to last year’s adopted budget:

But here’s what feels a little funky about the presentation of these numbers: we just went through a mid-year update where the city recalculated its FY 2024-2025 projected revenues. Remember this table from earlier this year?
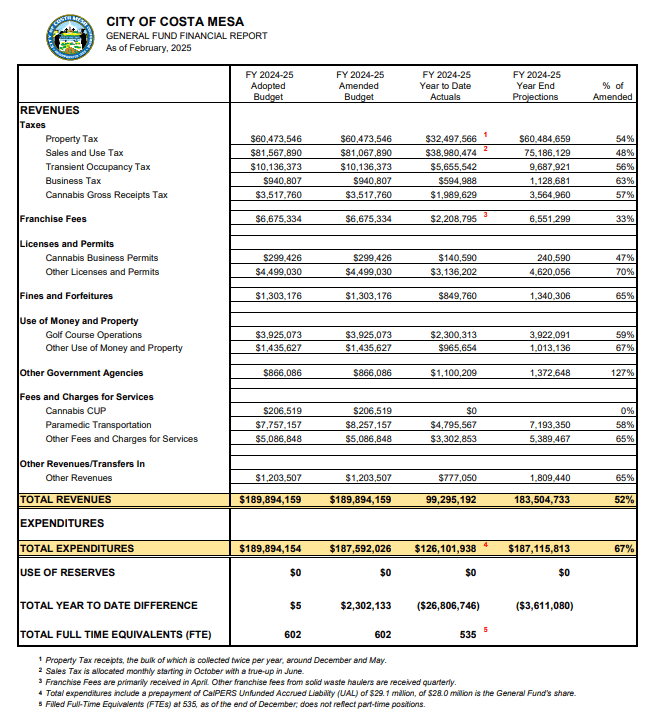
Squint and you’ll see that, based on our actual numbers, FY 24-25 revenues were projected to be only $183,504,733, a $3,611,080 miss from the FY 24-25 budget estimate adopted back in June 2024. Comparing that revised revenue estimate number to the new general fund revenue estimate for FY 2025-2026 of $186,855,606, revenues are actually expected to… rise just over $3.3 million year-over-year?
This is why I’m drilling down on that missing CAN money: We missed meeting the city’s full CAN obligation last year by about $2.9 million due to revenues missing targets by $3.6 million. But now revenues are going to rise $3.3 million next year, and the city can’t fulfill any part of an almost $7 million CAN obligation?
That… doesn’t make sense.
The revenue numbers also don’t seem to jive with the “we’re in an economic downturn” narrative, which is critical to analyzing how the city should apply the CAN ordinance. Look even closer to the FY 25-26 revenue estimates and you’ll see predictions of effectively flat revenues in the two tax categories most influenced by the larger economy: sales tax (FY 24-25 revised estimate: $75,186,129, FY 25-26 estimate: $75,050,176, an ~0.2% decrease) and transient occupancy tax (FY 24-25 revised estimate: $9,687,921, FY 25-26 estimate: $9,843,276, a ~1.6% increase). If we slide into a worldwide recession, and if the Trump administration’s “liberation day” policies continue to roil international trade and tourism, is it a reasonable assumption that our highly sensitive sales and TOT tax revenues will be flat?
Honestly, I’m not finding the revenue hypothesis particularly convincing. To be clear I’m a big believer in the theory that, in California at least, local governments are chronically underfunded and that they should seek revenue sources wherever it can reasonably find them. But in this specific case, it doesn’t make sense to me that a dip in expected revenue is explaining our $7 million CAN hole for next year. Staff’s projections predict an increase, rather than a decrease, in overall general fund revenue compared to this year’s updated estimates, and I’m concerned those projected revenues might be a bit rosy given everything going on in the world.
So… where is the money?
The spending hypothesis
First, let’s figure out where the money is going in the FY 25-26 budget so we can establish a baseline. In full disclosure 🤖🐐ROBO-Goat is gonna help me out in this section quite a bit because there is a lot of analytical heavylifting involved. Here’s the FY 25-26 general fund spending summary, setting aside capital improvements:
- Salaries and Benefits ($137,367,315 proposed for FY 25-26)
- Includes regular salaries for sworn and non-sworn employees, overtime, various compensation types, retirement, and benefits
- This is the largest expense category, representing about 73.5% of the total general fund budget
- Maintenance and Operations ($43,726,192 proposed for FY 25-26)
- Covers a wide range of operational expenses including utilities, maintenance, consulting services, legal fees, rent, insurance, and more
- Notable items include landscaping and sprinklers ($3.4M), public safety ($3.2M), and legal services ($2.88M)
- Fixed Assets ($2,964,263 proposed for FY 25-26)
- Primarily consists of equipment purchases, with “Other Equipment” being the largest allocation
- Transfers Out ($2,797,836 proposed for FY 25-26)
- Money transferred from the General Fund to other city funds
Now let’s get into the details. I really wanted to see how things had changed from FY 2022-2023, just coming out of the shell shock of COVID, to this proposed budget. This revealed some interesting trends. For your reviewing pleasure, here are the spending areas that project the greatest increases and decreases in spending between FY 22-23 and FY 25-26:
Greatest Increases (FY 22-23 to FY 25-26 Proposed)
- Regular Salaries – Non-Sworn: +$11.9M (50.3% increase)
- Non-sworn salaries have increased from $23,677,179 in FY 22-23 to $35,588,157 in FY 25-26. Note that, while the city has added employees (FTEs increased from 664.81 in FY 22-23 to 706.48 in FY 25-26 (6.3% growth)), the aggregate salary spend for these employees has gone up disproportionately. We are clearly paying people more.
- Of all departments, the City Manager’s department saw the largest growth, growing from 37 FTEs to 49 FTEs between FY 22-23 and FY 24-25. That said, the City Manager department now proposes to reduce its headcount to 45 FTEs in FY 25-26.
- Regular Salaries – Sworn: +$4.7M (19.2% increase)
- From $24,608,500 in FY 22-23 to $29,325,600 in FY 25-26. Like non-sworn positions, regular salaries for sworn officers went up more significantly than could be explained by adding positions alone (FTEs in Police and Fire combined went from 318 FTEs in FY 22-23 to 340 FTEs in proposed FY 25-26, an approximately 6.9% increase, with almost all new hires coming out of the CMPD). However, the growth was less disproportional than in non-sworn positions.
- Cafeteria Plan (employee benefits): +$3.5M (34.0% increase)
- From $10,248,439 in FY 22-23 to $13,735,999 in FY 25-26. I suppose food and labor inflation might be driving this cost but that’s a painful amount of money to be spending on the employee cafeteria.
- Retirement: +$7.4M (22.1% increase)
- Payments for employee retirement have grown from $33,260,085 in FY 22-23 to $40,623,510 in FY 25-26. This is a nice reminder that, for every dollar of new salary, you’ll see some portion of that dollar multiply itself in retirement payments.
- Longevity Pay: +$1.0M (631.2% increase)
- This one is an eyepopper: The City logged $163,174 in “longevity” bonuses (i.e., seniority bonuses to employees) in FY 22-23, and that has skyrocketed to $1,192,161 of such payments budgeted in FY 25-26. I don’t know the history of our employee union contract negotiations but I wonder if that has something to do with this big bump.
- Legal Services: +$1.2M (69.4% increase)
- Several Council Members noticed that legal services had jumped up from last year, but looking at the larger trend makes it look even worse: our legal spend budget has grown from $1,699,949 in FY 22-23 to $2,880,000 in FY 25-26. It’s hard to attribute an almost 70% increase in that time entirely to inflation; clearly, we are asking our legal teams to do more work.
Greatest Decreases (FY 22-23 to FY 25-26 Proposed)
- Transfers Out: -$19.8M (87.6% decrease)
- From $22,577,987 in FY 22-23 to $2,797,836 in FY 25-26. Factoring out somewhat extraordinary spend in FY 22-23, the decrease is almost entirely due to the assumption the City Council will forego funding the CAN in FY 25-26.
- Streets, Alleys and Sidewalks: -$587K (61.2% decrease)
- This one surprised me: we’ve reduced spending on maintaining streets, alleys and sidewalks from $958,785 in FY 22-23 to $371,610 in FY 25-26. To me, this represents something like a “stealth” defunding of capital asset needs spending. Hard assets like sidewalks aren’t exactly “capital assets” but they depreciate and require maintenance just the same. Plus, if we’re spending money on legal due to trip-and-fall cases, perhaps defunding preventative maintenance isn’t so wise.
- Overtime: -$2.2M (30.9% decrease)
- From $6,989,413 in FY 22-23 to $4,828,573 in FY 25-26. This one is plausible if, thanks to hiring more employees (especially in the CMPD) we are relying less on overtime to fill the gap. But it could also be wishful thinking.
- Safety and Health: -$550K (45.5% decrease)
- From $1,208,106 in FY 22-23 to $658,122 in FY 25-26. Maybe we’ve eased up on PPE and other disease-prevention spending now that the COVID-19 pandemic has abated?
My first reaction to these numbers is that spending categories that are growing the fastest (salaries, benefits, and legal services) are growing faster than we are finding savings in other areas (basically, capital improvements and overtime). Therefore, overall spending is definitely going up.
That isn’t necessarily a bad thing. The city should want to improve and expand its services over time, and city revenues have generally been growing during this period. So seeing spending going up isn’t a red flag in and of itself.
But what is a bit concerning is that the rate of growth in these highlighted categories is quite high, and in some cases pacing or even beating overall inflation. What that says to me is that, absent a course correction in terms of policy and approach, these categories are going to continue to grow at a reasonably high rate. And again, maybe that is ok: strong salary and benefit growth might just be what is necessary to keep the city humming by attracting the highest quality people. But if that is the case, we need to figure out where that (potentially necessary) money is going to come from.
To get a sense for what kind of additional spending we might be solving for, I asked 🤖🐐ROBO-Goat to project the FY 2026-2027 budget amounts for the categories with the greatest increases by analyzing the growth trends from FY 22-23 to FY 25-26 and extending them forward. I recognize that this is a bit of a messy approach because the data from FY 22-23 and FY 23-24 are actual, audited numbers while the FY 24-25 numbers are basically estimates, but hey: it’s the data we got.
Based on the trends from FY 22-23 to FY 25-26, 🤖🐐ROBO-Goat projected what each of the top increasing categories might be budgeted for in FY 2026-2027. It used multiple projection methods (average annual change, compound annual growth rate, and linear regression) and averaged them for a balanced forecast.
WORD OF CAUTION: THIS IS JUST AN EXERCISE, NOT AN ACTUAL PROJECTION. I AM WELL AWARE THAT THESE NUMBERS ARE AFFECTED BY MANY FACTORS. THE POINT IS TO SHOW WHAT CONTINUAL GROWTH IN THESE AREAS WOULD LOOK LIKE. PLEASE DO NOT MISTAKE THE PRECISION OF NUMBERS CALCULATED TO THE DOLLAR FOR ACCURACY IN PROJECTION. So with the shouting out the way:
| Category | FY 22-23 | FY 25-26 | FY 26-27 (Projected) | Increase FY 25-26 to FY 26-27 | % Increase FY 22-26 | Est. Annual Growth Rate |
|---|---|---|---|---|---|---|
| Regular Salaries – Non-Sworn | $23,677,179 | $35,588,157 | $38,875,448 | $3,287,291 | 50.3% | 16.8% |
| Cafeteria Plan | $10,248,439 | $13,735,999 | $14,912,159 | $1,176,160 | 34.0% | 11.3% |
| Retirement | $33,260,085 | $40,623,510 | $43,207,250 | $2,583,740 | 22.1% | 7.4% |
| Regular Salaries – Sworn | $24,608,500 | $29,325,600 | $31,139,457 | $1,813,857 | 19.2% | 6.4% |
| Longevity Pay | $163,174 | $1,192,161 | $1,552,154 | $359,993 | 631.2% | 210.4% |
| Legal Services | $1,699,949 | $2,880,000 | $3,280,017 | $400,017 | 69.4% | 23.1% |
| TOTAL | $93,657,326 | $123,345,427 | $132,966,485 | $9,621,058 |
The punchline: if we use our experience in the past three years to estimate how spending in these high-growth categories will play out, we are likely to see significant increases — possibly in the $9-10 million range — in recurring spending that needs to be accounted for somewhere. We’ve accounted for the historical increases in these categories by exploiting increased revenues (think federal/state grants, inflation buoying our sales/TOT taxes, and home value appreciation juicing our property taxes). But when the revenue music stops, these costs keep rising, and other city priorities start to suffer.
This is why I led with the absolutely awful pun of the “CANary in the coal mine”. The CAN isn’t some sacred policy. It is a signal that the overall fiscal health of the city isn’t where we want it to be, because we’re starting to lean on cuts to routine maintenance and capital improvements to fund our employment needs. We’re absolutely NOT broke. But we are getting a bit overweighted on salaries and benefits if our revenues aren’t going to continue to grow.
And that is really the big takeaway here. Our spending, particularly on our employees, is going to increase. Yes, putting strict controls on hiring new FTEs and/or retooling our compensation approach would help, and that should be looked at. But we are in a perpetual cost-of-living vice and its grip tightens through (1) the salary and benefit increases needed to stay competitive with other cities and (2) the expanded services the community expects the city to provide. And that’s not going to stop any time soon.
So either we accept that we’re not going to be able to deliver those expanded services, or we need to find new sources of revenue. And to staff’s credit, they seem to recognize that. The study session did have one little newsy item, which was that the staff is now proposing a few new fees for next year, as well as proposing to revisit certain recreational fees:

But let’s be honest: these are fees, not taxes, and they’re going to be a drop in the bucket compared to the amount of revenue the city is going to need in future years.
Some of the City Council members, notably Mayor Stephens and Mayor Pro Tem Manuel Chavez, voiced at least curiosity about raising the TOT tax to match neighboring jurisdictions. That’s probably more along the lines of scale that will be needed. But honestly, the city probably needs to start exploring new revenue sources altogether. It will be interesting to see the extent to which that idea takes hold this year.

Leave a comment